#1. How to Read Candlesticks in Intraday Trading? [ Stock Trading Courses]
Channel: Mahendra kori
Category: Education
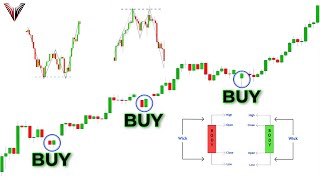
Tags: candlestick charttechnical analysis tutorial for beginnershow to read candlestick patternshow to read candlestickhow to read candlesticks in tradinghow to read candlestick in share markettechnical analysis in hindihow to read candlestick chartstechnical analysis of stockstechnical analysiscandlestick patternscandlestick chartsmahendra kori
Description: A candlestick is a type of price chart used in technical analysis that displays the high, low, open, and closing prices of a security for a specific period. It originated from Japanese rice merchants and traders to track market prices and daily momentum for hundreds of years before becoming popularized in the United States. The wide part of the candlestick is called the "real body" and tells investors whether the closing price was higher or lower than the opening price (black/red if the stock closed lower, white/green if the stock closed higher). The candlestick's shadows show the day's high and low and how they compare to the open and close. A candlestick's shape varies based on the relationship between the day's high, low, opening, and closing prices. Candlesticks reflect the impact of investor sentiment on security prices and are used by technical analysts to determine when to enter and exit trades. Candlestick charting is based on a technique developed in Japan in the 1700s for tracking the price of rice. Candlesticks are a suitable technique for trading any liquid financial asset such as stocks, foreign exchange, and futures. Long green candlesticks indicate there is strong buying pressure; this typically indicates the price is bullish. However, they should be looked at in the context of the market structure as opposed to individually. For example, a long white candle is likely to have more significance if it forms at a major price support level. Long black/red candlesticks indicate there is significant selling pressure. This suggests the price is bearish. A common bullish candlestick reversal pattern, referred to as a hammer, forms when price moves substantially lower after the open, then rallies to close near the high. The equivalent bearish candlestick is known as a hanging man. These candlesticks have a similar appearance to a square lollipop and are often used by traders attempting to pick a top or bottom in a market. 00:00 Introduction 00:42 Types of Analysis 03:09 History of Candlestick 04:51 What is Bullish and Bearish 06:01 How to Read Candlestick 09:59 Questions Copyright Disclaimer: - Some contents are used for educational purposes under fair use. Copyright Disclaimer under Section 107 of the Copyright Act 1976, allowance is made for "fair use" for purposes such as criticism, comment, news reporting, teaching, scholarship, and research. Fair use is a use permitted by copyright statutes that might otherwise be infringing. Non-profit, educational, or personal use tips the balance in favor of fair use.